Lunar Technosignatures.
Teaching machines to find what doesn't belong on the Moon — an anomaly-detection approach to spotting the Apollo 15 and 17 landing sites in orbital imagery.
Tom Sander & Christian Wöhler · VISIGRAPP 2025
Why search the Moon?
Uncovering anomalies on the lunar surface is crucial for understanding the Moon's geological and astronomical history. Traditionally, experienced analysts inspect high-resolution images by hand to find features that don't fit the norm — a process that is slow, subjective, and impossible to scale across an entire orbiter archive. This study replaces that manual search with anomaly-detection models, and uses the Apollo landing sites as a benchmark.
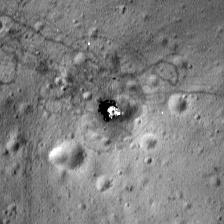
The landing sites are the ideal test case: their descent-stage hardware is genuinely anomalous against the surrounding regolith, and — unlike most lunar anomalies — their exact position is known. That gives us rare ground truth to measure each method against.
The data: LRO NAC
The imagery comes from the Narrow Angle Camera (NAC) aboard the Lunar Reconnaissance Orbiter, downloaded through the NASA Planetary Data System. We use one high-resolution TIFF per landing site.
| Landing site | Image ID | Incidence angle | Resolution |
|---|---|---|---|
| Apollo 15 | M175252641LR | 49.39° | 0.406 m/px |
| Apollo 17 | M113758461R | 55.72° | 0.515 m/px |
Each NAC image is cut into 224×224-pixel patches. Training uses a stride of 28, yielding roughly 492,070 patches for the Apollo 15 image; the held-out landing site is then re-tiled with a stride of 8, giving about 5,476 test patches per site. The models never see a labelled anomaly during training — they only learn what normal lunar terrain looks like. See how the dataset was built →
Three ways to spot an anomaly
We compared three state-of-the-art anomaly detectors, each with a different notion of what "abnormal" means — a reconstruction error, a student-teacher disagreement, and a self-supervised classifier.
AnoViT
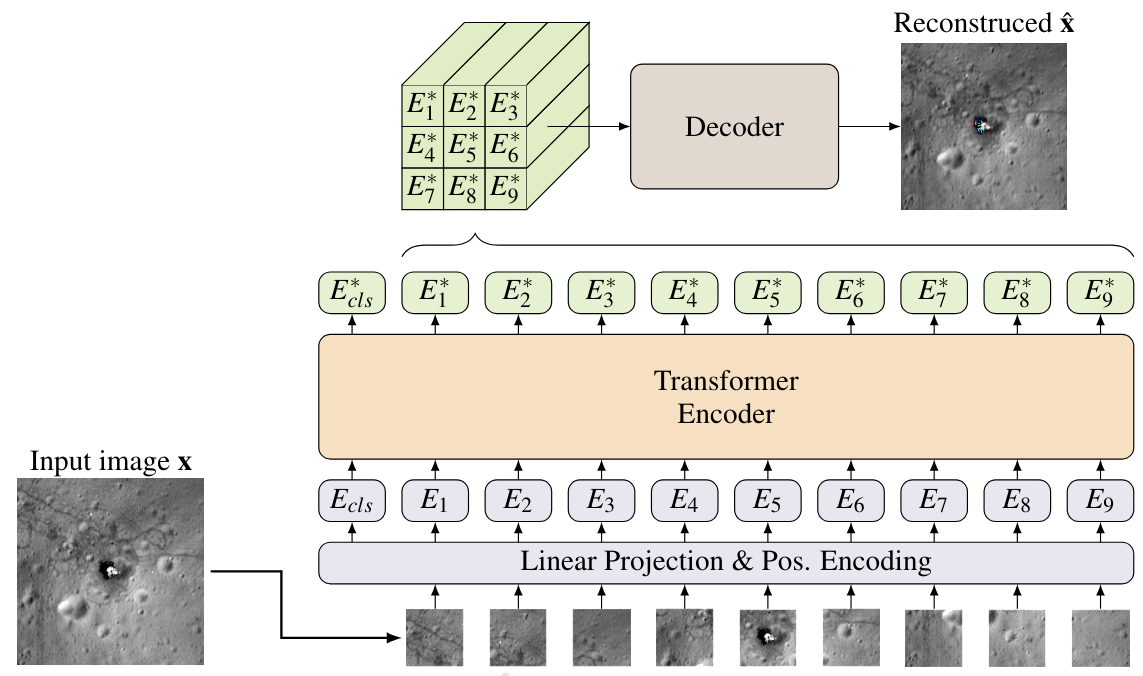
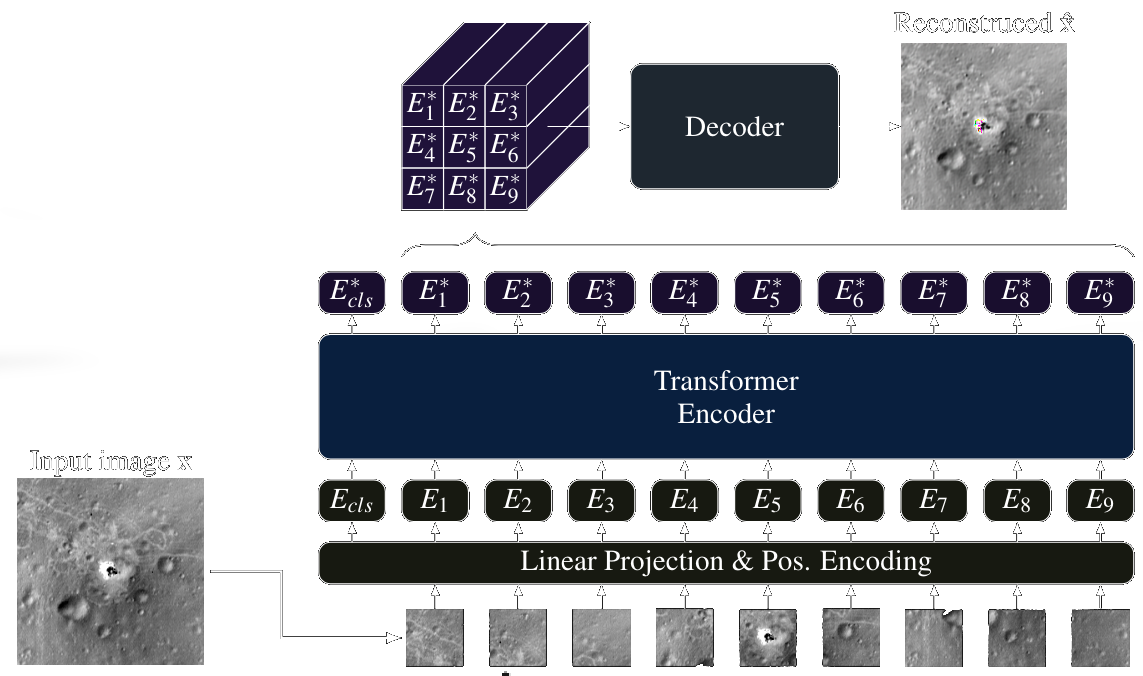
Vision Transformer AutoencoderThe AnoViT method uses an Autoencoder approach to detect anomalies. It uses a Vision Transformer (ViT) as an encoder, and the resulting features are used to reconstruct the input image using a Convolutional Neural Network (CNN) decoder. The reconstruction error reveals anomalous regions that the model has never encountered during training.
EfficientAD
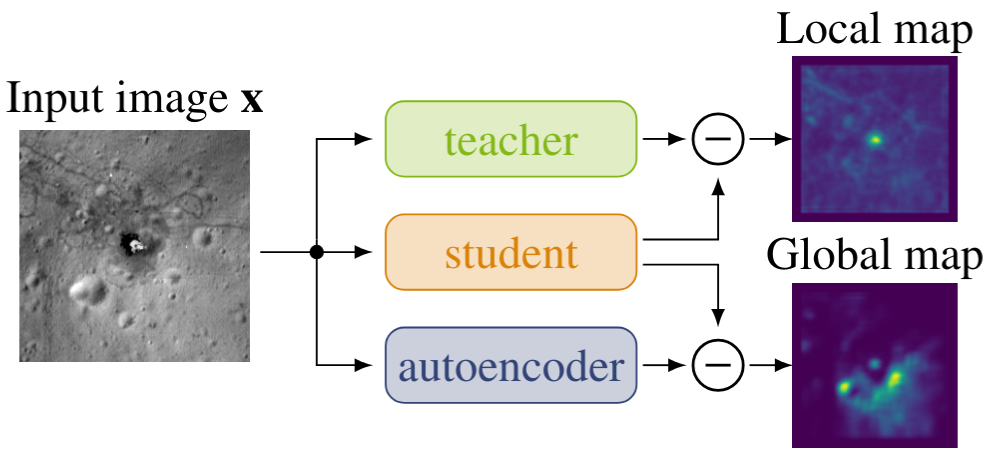
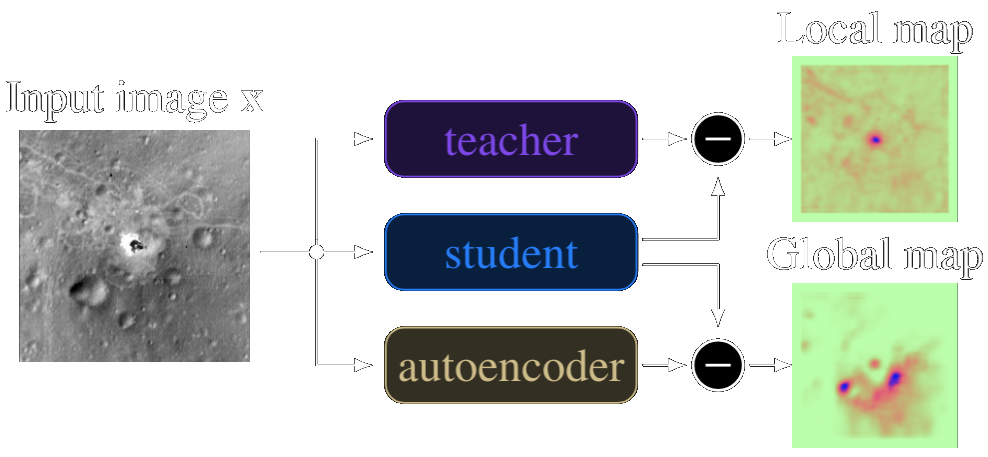
Student-Teacher FrameworkThis approach uses a student-teacher framework along with an Autoencoder to identify anomalies at both local and global scales. A pre-trained teacher network provides feature targets; the student network learns to mimic these on normal data. During inference, significant differences between the student and teacher outputs are considered indicators of anomalies.
Cut&Paste
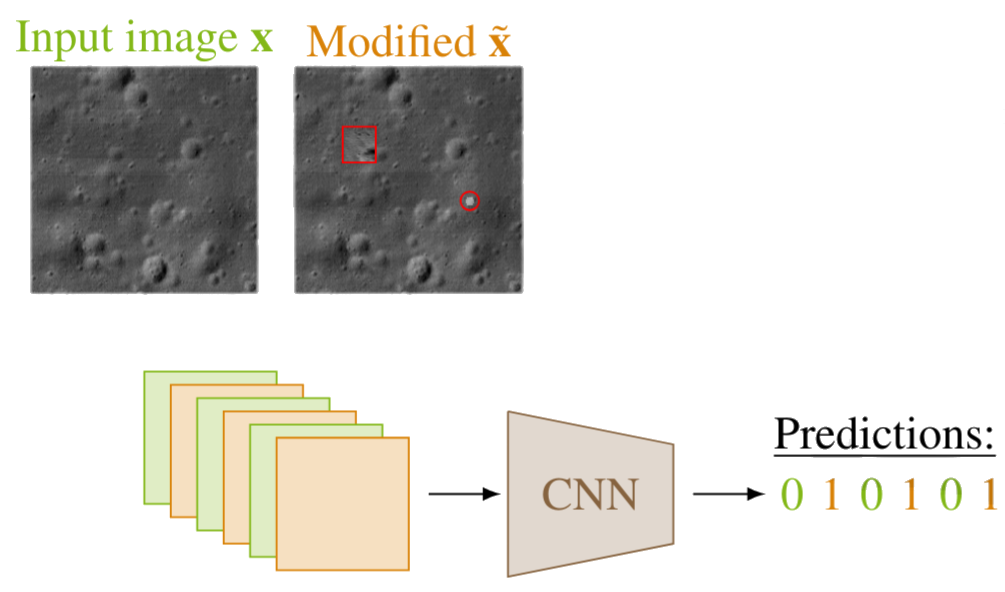
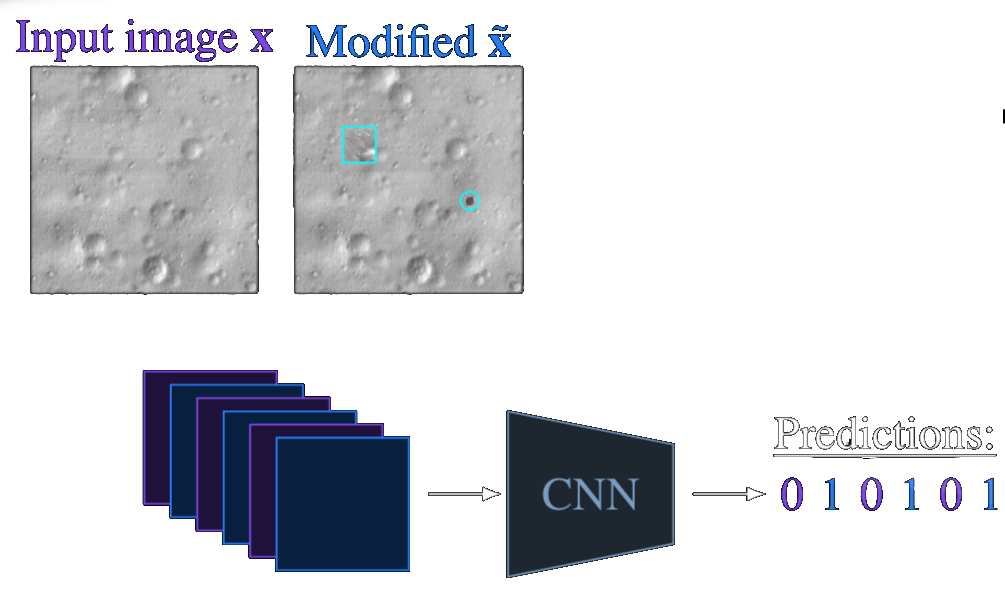
Synthetic Anomaly GenerationThis method converts the unsupervised anomaly detection problem into an artificially constructed supervised classification task. Synthetic anomalies are generated by cutting patches from normal images and pasting them back with augmentations. It was trained with five different transformations including mean patch, whiten blob, darken blob, and a darken path transform.
Forge your own anomaly
The Cut&Paste model never sees a real anomaly. Instead it learns to spot terrain that has been tampered with — patches cut and pasted elsewhere, regions blurred to the image mean, small blobs lightened or darkened, or paths scratched across the surface. Apply the paper's five synthetic transforms to a real NAC patch and watch a "fake anomaly" appear.
Pick a transform to forge an anomaly.
Explore the detections
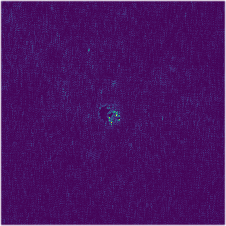
Each model outputs an anomaly map — brighter means "more surprising". Pick a method, then drag the threshold to binarize the map: everything the model scores above the cut-off lights up in accent. Switch to the global view to see the whole test area at once, where false positives become obvious.
Thresholding the published colour-mapped maps is a visual proxy for the model score — not the paper's calibrated operating point.

How they scored
AnoViT produces the sharpest global map and wins on almost every metric, while EfficientAD holds the best precision-at-threshold (PaTR). The descent stage is surrounded by more noise in the EfficientAD and Cut&Paste maps — visible in the global view above. Overall the approach beats prior work: on Apollo 17, average precision rises from Lesnikowski et al. (2020)'s 0.49 to 0.62.
Full results table
| Method | Accuracy | Precision | Recall | AUC | PaTR | AP |
|---|---|---|---|---|---|---|
| Apollo 15 | ||||||
| AnoViT | 0.9821 | 0.9226 | 0.9675 | 0.9874 | 0.3396 | 0.8978 |
| Cut&Paste | 0.8093 | 0.4360 | 0.7149 | 0.8400 | 0.1575 | 0.3566 |
| EfficientAD | 0.9125 | 0.7395 | 0.8765 | 0.9461 | 0.4736 | 0.6855 |
| Apollo 17 | ||||||
| AnoViT | 0.9091 | 0.6241 | 0.9666 | 0.9329 | 0.3020 | 0.6082 |
| Cut&Paste | 0.8615 | 0.5669 | 0.2670 | 0.8489 | 0.1694 | 0.2596 |
| EfficientAD | 0.8922 | 0.6818 | 0.9067 | 0.9035 | 0.4399 | 0.6226 |
Dataset & code
Dataset information
The images were acquired by the LRO NAC instrument and can be downloaded through the NASA Planetary Data System (PDS). For a detailed technical walkthrough on how to construct and preprocess the exact dataset used in this study, please refer to the dedicated dataset documentation.
View Dataset Construction GuideExplore the Code
All implementations and pre-trained models are publicly available.